TR Designs Compared
Comparison Approach
Tests evaluating physical habitat and sediment transport regime involved computing and comparing statistical distributions for the performance indicators for GHSI and Shields stress datasets as well as visual comparisons of the spatial patterns of GHSI and Shields stress to evaluate mechanisms. A summary table was produced in which the best performing design(s) were identified for each GHSI indicator, and then the best overall design was evident as the one with the most occurrences as the best performer across all the metrics. An identical analysis was done for Shields stress. Picking the best design was a necessary part of the real-world project, while the comparison alone is more interesting to appreciate the circumstances in which each landform sequence has value for different sets of project objectives. Therefore, design response according to different performance indicators was assessed relative to differences in riffle pool relief (ARP) and riffle asymmetry (A*RP).
For physical habitat quality, the performance indicators were the percent distribution of GHSI bins, the habitat efficiency for habitat creation (defined below), the habitat efficiency for habitat improvement (defined below), and spatial pattern of GHSI. Each of these indicators was used for each species’ lifestage. For the baseline channel and each alternative design, the percent of wetted area for each GHSI bin was plotted as a stacked column for each species’ lifestages and the one with highest percentages of suitable and preferred habitat were identified. Because each design has a different wetted area, care is required in cross-comparing this metric, as the design with the highest percent of something is not necessarily the one with the most area of it. Habitat efficiency is a cost/effectiveness metric where the cost is the amount of coarse sediment needed (in m3, but could be expressed in dollars per m3 of gravel placed) and the effectiveness is the amount of habitat, which can be expressed in different specific metrics as well. Habitat added means the net increase in suitable-habitat area (m2) per m3 of gravel added, while habitat improved means the net increase in preferred-habitat area (m2) per m3 of gravel added. Designs were directly compared for their performance in habitat efficiency. Habitat efficiency is a particularly useful metric when trying to prioritize among possible projects across many different sites of widely different morphologies. For example, turning a 10-m deep mining pit into a spawning riffle would require dumping a large amount of gravel that provides no direct habitat functionality, yielding habitat only at the “tip of the iceberg”. Such a project is economically inefficient compared to taking a shallow glide and adding a 0.5-m veneer to obtain a riffle crest for which the full depth is being used by spawners. Assessing the relative merits of habitat efficiency in terms of addition of suitable habitat versus improvement of habitat to the preferred state involves more professional judgment, so both metrics are worth considering as performance indicators. As justified earlier, more weight was given to habitat improvement for spawning in this study on the basis of the percentage utilization versus percentage availability tests of Elkins et al. (2007), while more weight was given to habitat addition for fry. These choices can be varied for other systems and projects based on local expert judgment or stakeholder consensus- the important thing is that this study shows the relative merits of different landforms, especially with regard to different levels and asymmetries of riffle-pool relief. Finally, visual inspection of the spatial pattern of GHSI bins relative to the DEM for each design enabled easy determination of the link between morphological units and habitat patterns to help explain why the pattern of habitat was turning out the way it was in each case.
For sediment transport regime, three performance indicators were used. First, the % wetted area with Shield stress > 0.06 and that for 0.03 < Shield stress < 0.06 for each scenario when discharge is 8.5 m3/s were used to compare the risk of unacceptable ecological disturbance during the period of bed occupation by redds, embryos, and fry. Second, the % wetted area with Shield stress > 0.06 and that for 0.03 < Shield stress < 0.06 for each scenario when discharge is 169.9 m3/s were used to compare the potential of channel change for the ecological function of “bed preparation” (Escobar and Pasternack, 2010). Finally, the stage-dependent location of peak Shield stress for each scenario was inspected for evidence of flow-convergence routing of sediment through pools as a performance indicator of the resilience of riffle-pool relief under existing reservoir operations.
Physical Habitat Comparison
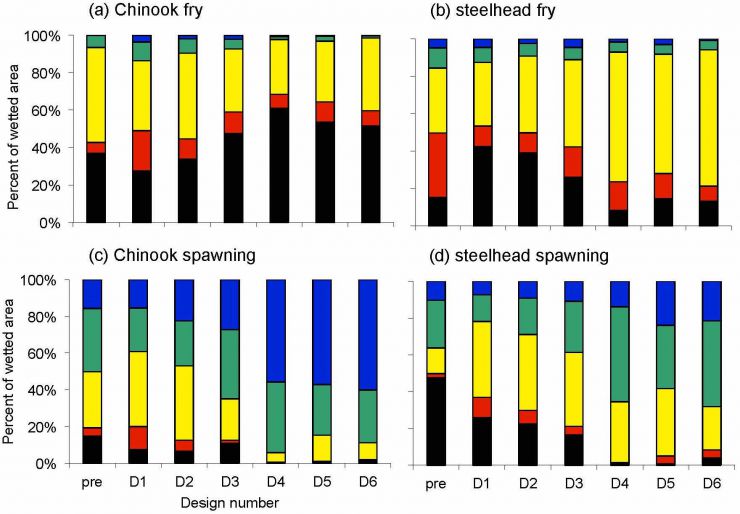
The statistical distribution of GHSI bins shows systematic differences in habitat benefits between designs using accentuated topography and those using blanket fills in terms of riffle-pool relief (see figure to the right). Depending on what the habitat goals of a rehabilitation project are aiming for, clear landform preferences are evident. Designs 1 and 2 had the most accentuated topography and they yielded the largest percent areas of suitable and preferred Chinook fry habitat. A key result was found in comparing Chinook and steelhead fry performance in percent area of habitat. Because the steelhead-fry velocity HSC has a broader range and a higher velocity of peak preference than that for Chinook fry, the blanket-fill designs yielded significantly higher percent areas of suitable habitat compared to the accentuated-topography ones. However, the accentuated-topography designs provided the highest percentages of preferred steelhead fry habitat. Designs 4, 5, and 6 all yielded high-quality Chinook spawning habitat over >55% of the wetted area and medium-quality habitat over another 28-39% of it. Preferred steelhead spawning habitat was also present in high percentages for these blanket-fill designs. The accentuated topography designs provided improvements over the baseline in terms of percent area of suitable habitat, but did not necessary achieve that for preferred habitat, which is the more important metric for spawning habitat.
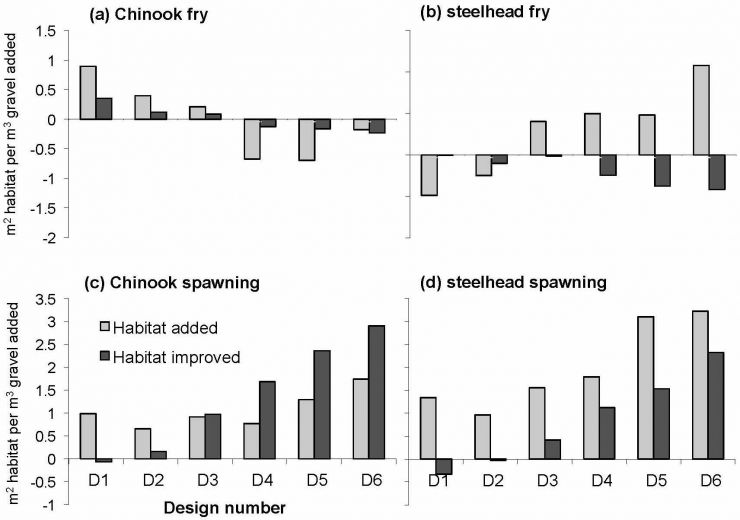
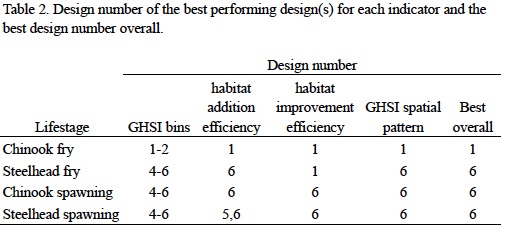
The habitat-efficiency performance indicators yielded similar outcomes as those using the GHSI bins for spawning, but were particularly helpful in distinguishing relative benefits within each riffle-pool relief grouping (see figure to the right). The habitat-addition and habitat-improvement efficiencies of Design 1 were more than double those of the next highest performer (Design 2) for Chinook fry. Also, while Design 1 had the least harmful effect on steelhead fry preferred-habitat loss, it caused the most loss of suitable habitat for steelhead fry. Design 6 had the opposite outcome, yielding more than double the gain in suitable steelhead fry habitat compared to the next best performing designs (Four and Five). For both Chinook and steelhead spawning, the blanket-fill designs performed best across habitat efficiency metrics, and among those Design 6 was the best. Across all eight habitat-efficiency metrics for all species’ lifestages (Table 2 below, efficiency columns), Design 6 was the best for five and the worst for only one (Chinook fry habitat-improvement efficiency).
The maps of the spatial patterns of GHSI bins (see web pages with 2D model results for each design) provide insight about why the designs perform differently. For brevity, only design 1 and 6 compared in this text. For Design 1, preferred spawning habitat is located in riffle entrances and to a much smaller extent on the periphery of channels, especially where there are lateral bars. Accentuating the topography created riffles that were too short, shallow, and fast to serve as spawning habitat. Since the pools are nonhabitat for spawning, then there is just too little area for spawning when topography is accentuated. An interesting nuance to that outcome is evident in the first riffle in Design Three, which had a small, high crest bounded by longer flat shelves of riffle entrance and exit. For that riffle, the crest was only low-quality habitat, but both shelves had medium-quality habitat with high-quality habitat along both banks. That suggests some benefits to having multiple elevation tiers to a riffle. Nevertheless, the really important result was the finding that Design 6 yielded nearly ubiquitous high-quality Chinook spawning habitat and widespread preferred steelhead spawning habitat. Design 6 had diverse landform features at multiple spatial scales and many of them had spawning value from a hydraulic perspective.
In terms of the fry lifestage, the GHSI maps show that the accentuated-topography designs yield significantly more preferred fry habitat, because they produce slackwater areas (sometimes large, slowly recirculating eddies) on the periphery behind each riffle crest. Abrupt bed-elevation increases caused flow to converge, yielding a narrower effective flow width bounded by slackwater or recirculating eddies. The higher the bed-elevation increase, the stronger the effects. This is the concept used in whitewater park design, where bed and width constrictions focus flow to produce standing waves for kayak stunts and intervening peripheral pools for kayakers waiting in line for their turn. Numerically, the blanket-fill designs performed poorly for Chinook fry habitat, because velocities were too fast, given an exponentially decreasing velocity HSC. The blanket-fill designs in this study yielded insufficient depth and width undulations to create the sheltering observed in the accentuated-topography designs. However, steelhead fry use the widespread, moderately higher velocities found in the blanket-fill designs, so the blanket fill is beneficial for them.
Sediment Transport Regime Comparison
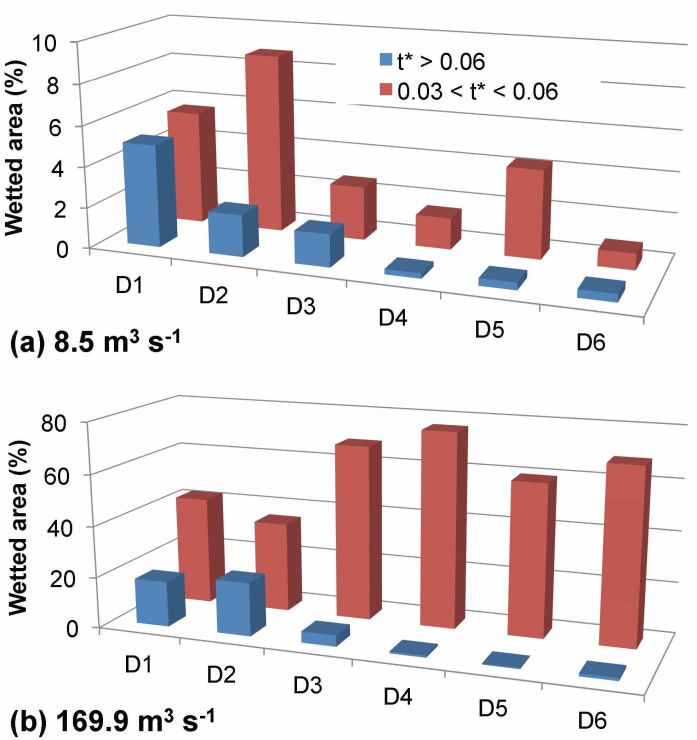
The statistical distributions of Shields stress bins for Shield stress > 0.06 and 0.03 < Shield stress < 0.06 indicated the relative resilience of each design across an order of magnitude of discharge (see figure to the right). At low discharge (8.5 m3/s) when embryos are at risk of being scoured out, < 5% of the wetted area was in the full transport regime for each design, with the highest values associated with the designs having the highest ARP (One, Two, and Three). The partial-transport bin showed at-risk areas of < 9%, with the highest values associated with designs having the highest overall bed slope (One, Two, and Five). The Shield stress maps helped explain the difference in response of these two metrics at low flow (Fig. 8a,b). Higher overall bed slope drives higher overall velocities, especially on riffles at within-bank flows, which is indicative of a higher area with Shield stress > 0.03. Higher ARP is indicative of the presence of over-steepened riffle exits, which causes an abrupt local velocity increase capable of driving knickpoint migration.
At high discharge (169.9 m3/s), there is a marked difference in resilience between the accentuated topographies and the blanket-fill ones. Similar to low discharge, the designs with the highest ARP (Designs One, Two, and Three) had the largest percent area of full bed mobility (4.4-21%). Meanwhile, the designs with the lowest slope had the highest percent areas of partial transport (60-76%). These patterns are explained using the Shield stress maps and Stewardson and McMahon’s (2002) conceptual model of hydraulic variations within stream channels, as applied to the Trinity River by Brown and Pasternack (2008). According to this concept, there is a flow dependence to the transition of a river’s hydraulic regime from one dominated by longitudinal velocity variation at low flow to one dominated by lateral velocity variation at high flow. As illustrated in this numerical experiment, the exact discharge required for the transition is dependent on riffle-pool relief. Specifically, for the accentuated-relief designs, the riffle crests are so high that even at 169.9 m3/s, there is a strong longitudinal velocity variation with high velocities and shear stresses focused on riffle crests and an abrupt increase in velocity at the oversteepened riffle exits. In contrast, this discharge is high enough for the blanket-fill channels to surpass the transition in hydraulic regime to lateral-variation dominance. As a result, these channels distribute velocity response to overall bed slope evenly along their length, avoiding focal points for scour. Design 3 is a hybrid between the two in that its ARP is just enough that the riffle crests peak up causing a longitudinal hydraulic variation at this flow and focusing scour at riffle exits somewhat.
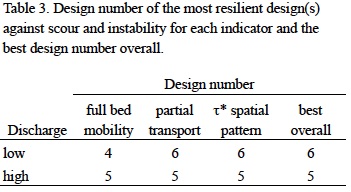
Based on the six Shield stress-bin performance indicators, all the blanket-fill designs outperform the accentuated-topography designs, but among them there is not a universal standout (Table 3). Design 6 is the best performer at low flow, because it exhibits the lowest percent area of partial transport, highest percent area of Shield stress < 0.03, and best pattern of Shield stress in terms of avoiding riffle-crest scour. The only problem with Design 6, which is very minor, is that the very end of the last riffle exit drops off enough to cause a sliver of partial transport, with a few spots experiencing full bed mobility. Design 4 has a more gradual final riffle exist, so it avoids that problem, but does have larger zones of partial transport in other places on riffle crests. Design 5 is the best performer at high flow, because its bar configuration helps to focus flow in the center where peak velocity is the most even along the channel among design and yielding the strongest lateral velocity variation. Design 6 also has those bars and it has just enough lateral constriction after each riffle to help induce a similar centralized focusing of velocity and scour potential over pools. However, its long, shallow riffles do experience partial transport over nearly their full width.
Lessons From Design Experimentation
Sequences of riffle-pool units designed with different riffle-pool relief attributes exhibit systematic and predictable variations in flow-dependent physical habitat patterns and geomorphic processes in a setting with a relatively uniform channel width. In general, this study found that modest riffle-pool amplitudes (<0.75 m; ARP/D50~10-12, where D50 is median bed-material particle size) from blanket-fill designs yielded the largest habitat addition and habitat improvement efficiencies, especially for salmon spawning. The Chinook fry lifestage was the exception, as high riffle-pool relief yielded large peripheral eddies in the lee of riffle crests. Similarly, analysis of patterns of sediment transport potential found that high-relief configurations had significantly more area of full bed mobility, regardless of flow. These configurations would be expected to fall apart quickly after construction as a result of knickpoint migration through riffle crests, due to oversteepened riffle exits.
For a given riffle-pool amplitude, differences in 3D bar morphology (including A*RP, but not well explained by it) yield significant differences in habitat and channel stability. For example, Designs 5 and 6 had ARP values of 0.75 and 0.74, respectively, but their performance indicators were significantly different. The use of longer riffle crests and curved tailouts in Design 6 turned out to be important drivers of superior habitat performance. Meanwhile, the orthogonal bar forms and lower riffle exit slopes in Design 5 helped avoid knickpoint migration, which is a risk in Design Six, especially at even higher flows that were not modeled in this study. Design 5 had a small peak to its last riffle crest that was predicted to experience a higher velocity at the high flow, but it is still in the partial-transport regime, so it is resilient. Design 6 had longer riffle-crest features to give them more resilience if knickpoint migration were to take place, but that evidently comes at the cost of increased knickpoint migration risk due to oversteepend riffle exits and the spreading of partial-transport across the full width of riffles. In evaluating these design alternatives, it was conjectured that at expected higher floods in the future, the last riffle crest in Design 5 would likely transition into the full-mobility domain and not have enough crest area to absorb the erosion and avoid the “reverse domino” riffle sequence collapse mechanism described by Pasternack et al. (2008). In contrast it was conjectured that the evident lower-flow full mobility at the riffle exits in Design 6 would simply lead to sloughing of material to naturally form a more gradual slope, because the length of full-mobility and the amount of bed-material cohesion are likely insufficient to sustain a migrating knickpoint. Therefore, it was deemed more valuable to have longer riffles more resilient to the largest flood releases than to have short riffles with certain resilience to the modeled flood release. Ultimately, the lack of feasibility of significant width increases at riffle crests fundamentally constrained instituting flow-convergence routing through this riffle-pool sequence, and that was repeatedly explained to project sponsors to ensure understanding of what Design Six would yield.
Final Design Selection
In this study, Design 6 was determined to be the best alternative, but after the point of selection additional work is performed to fine-tune the design and generate multiple flow, habitat, and geomorphic predictions across a range of discharges for later evaluation. Small changes in the selected design often must be made to insure that all available gravels and boulders are used as well as to account for new constraints that emerge when the design is vetted among all stakeholders and the public. Further thought and testing may enhance even the best of the alternatives with subtle changes. It may be desired to add layers of complexity onto the basic topography using specific structures at the hydraulic-unit scale (~0.1-1 channel width), such as boulder clusters, riparian shade, and streamwood jams. Hydraulic effects of jams are extremely difficult to simulate, but boulder clusters are feasible. Because habitat quantity and quality is stage-dependent, a more comprehensive view of the final design is obtained by modeling as wide a range of flows as the original topographic and on-going monitoring data allow. The final project design is converted into an easily followed grading plan for use by the contracted front-loader operator.
